Updated Fri 7 Dec 2018.
Running Xdebug remotely is very useful – you can add breakpoints, inspect and modify the state of all variables/objects and type PHP code into a live console. No need to manual add var_dump() statements etc.
It should save you a lot of time.
Unfortunately, while the setup should be straightforward, it’s easy to lose the programming time you save spending ages tweaking your Xdebug and PhpStorm configuration to get it to work in the first place. (In fact, I don’t think it’s worked correctly first time for me once.)
Also, you’ve probably got multiple projects, maybe running on different VMs, or using Docker (scroll down for special instructions for Docker on the Mac).
Drupal users:
There’s an element of “it just works” for Xdebug in the server/PhpStorm configuration when using Acquia Dev Desktop or Drupal VM.
Acquia Dev Desktop:
To enable/disable Xdebug:
edit /Applications/DevDesktop/php7_1/bin/php.ini
Uncomment the zend xdebug extension and turn on remote_enable
zend_extension=xdebug.so
xdebug.remote_enable = 1
Restart Apache – via one of:
- the DevDesktop UI
- the UI but with keyboard shortcuts,
cmd-2 (stop) then cmd-1 (start)
- CLI:
/Applications/DevDesktop/apache/bin/apachectl -k restart
Drupal VM:
To turn on xdebug, make sure you’ve got:
php_xdebug_default_enable: 1
and:
installed_extras:
[...]
- xdebug
Then run vagrant provision to build/rebuild (this won’t affect your site). Leave PhpStorm set to port 9000.
Everyone else (non Drupal):
On other installations, here’s my growing checklist when I try to use Xdebug and nothing happens:
(The following is based on Xdebug 2.4.0RC4 and PhpStorm 2016.2.1)
Step 1: you should identify whether it’s a complete lack of communication between Xdebug and the IDE, or if PhpStorm is receiving the data the data but is setup wrong.
Close and restart PhpStorm. Make sure PhpStorm is listening for PHP Debug Connections (bottom of Run menu, or green telephone icon top right), then reload your app in the browser.
What you’re looking for is either:
a) an ‘Incoming connection’ dialog the very first time you open a webpage of your app.
or
b) ‘Debug session was finished without being paused” in the Event Log.
Either of these confirms Xdebug is talking to PhpStorm and you can need not worry about your php.ini entries, the possibility you’re using the wrong port or that you forgot to trigger the bookmarklet – goto section B.
If nothing happened at all, go to section A.
A. Communication failure
- Ensure the bookmarklet (recommended) or browser addon you’re using to start/stop debugging is activated. You can use developer tools to verify the cookie is being sent.
- Is Xdebug installed? (check phpinfo() output)
- Does the Xdebug section of phpinfo() have this warning: “XDEBUG NOT LOADED AS ZEND EXTENSION”? You’re meant to use zend_extension=xdebug.so, not extension=xdebug.so – go to the wizard, paste in your phpinfo() contents and it’ll generate a fully customised set of commands to run (< 2-3 mins) to download the xdebug extension and compile it for your system. (I’ve had this problem break one site – further info).
- Make sure the bookmarklet’s cookie is correct, it should use PHPSTORM for the IDE key.
does the browser IDE key match xdebug.idekey in your php.ini file? (Verify correct config file is being loaded – have you confused configs for multiple versions or CLI/fpm – and correct value read from it by creating a test page with phpinfo() output.) Correction: specifying xdebug.idekey in php.ini is unnecessary. Note if you view the phpinfo() output, at the top of the Xdebug section there’s are two rows, listing the version and the IDE key. If xdebug.idekey is unset, XDebug will fall back to the value of $_SERVER[‘USER’], e.g. www-data, but regardless, as soon you activate your bookmarklet to start a debug session, the $_COOKIE[‘XDEBUG_SESSION’] is set to ‘PHPSTORM’ and that’s what’s passed through. (To test, start and stop a session whilst refreshing your phpinfo() page and watch the IDE key change.)
- php.ini – ensure xdebug.remote_enable is set to 1 (then restart php-fpm, refresh page and keep an eye out for ‘Debug session was finished without being paused’ in the Event Log)
- php.ini – you may well need xdebug.remote_connect_back = 1 too (again, restart php-fpm) – I’ve had multiple dev sites that require it – XDebug may be ignoring the connection from the debug client because it doesn’t match xdebug.remote_host, turning on remote_connect_back makes it ignore this and accept a connection from anywhere – make sure your dev machine is behind a firewall.
- Check the ports match – this can get reset by mistake. You may also need to use 9001 rather than the default 9000 if the latter is also being used by php-fpm on your server. Also, open the Event Log and look for a message like “Can’t start listening for connections from ‘xdebug’: Port 9000 is busy”. Ports must be set correctly in two places – xdebug.remote_port and PhpStorm’s preferences (Languages & Frameworks > PHP > Debug > Xdebug)
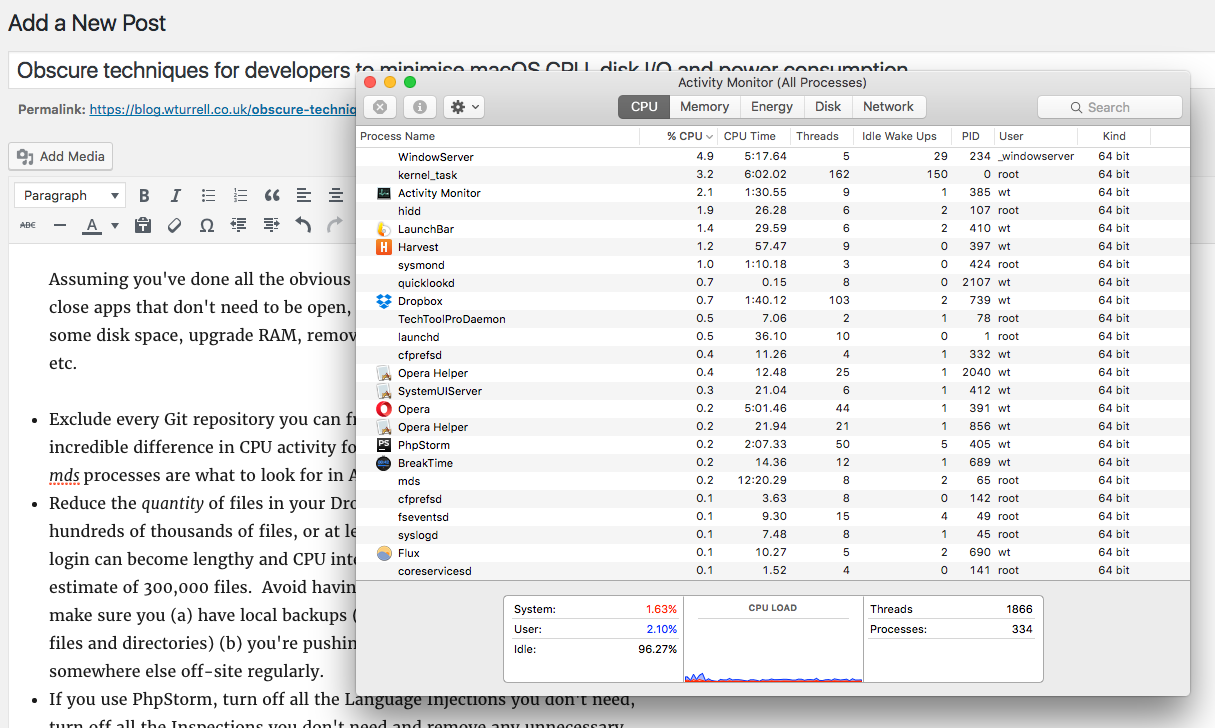
- You can verify both ends of this, the phpinfo() output will confirm what port Xdebug will send on. You can verify PhpStorm is actually listening on the correct port with the lsof command (this example from macOS):
wt$  sudo lsof -i :9001
Password:
COMMAND    PID USER   FD   TYPE             DEVICE SIZE/OFF NODE NAME
phpstorm 80592   wt  330u  IPv4 0xaad56de5076720c3      0t0  TCP *:etlservicemgr (LISTEN)
If PhpStorm is not listening this will be blank.
B. PhpStorm settings
- By default Xdebug won’t do anything if no breakpoints were found. Check the Event Log pane – there will be a warning message, e.g. “Debug session was finished without being paused”. Is there one?
- You may have configured Remote debugging to skip certain paths. In Preferences, check Languages & Frameworks > PHP > Debug > Skipped Paths (there’s no warning in Event Log if a script is skipped.) Are you trying to verify an AJAX request, when, for example in WordPress, you have previously blocked admin-ajax.php to avoid spawning a new debug session every time autosave is triggered?
- If PhpStorm is always stopping on the first line of the script but you don’t want it to, note that this option is specified in two separate places – one at the bottom of the run menu (“Break at first line in PHP scripts”) and also in Preferences (Languages & Frameworks > PHP > Debug > External connections)
- Path mappings can get confusing. The left section is the project files that PhpStorm is looking at. The column on the right needs to the path on the server – so you have a Vagrant box running on a Mac host, don’t use /Users/<name>/…, use /var/www/…, /usr/share/ etc. Double check PhpStorm has saved what you’ve entered correctly.
- If nothing’s happening, make sure all your previous debug sessions have finished. Press the stop button in the debug panel (cmd-F2 on Mac) and try reloading the page again. Also note also the Max. simultaneous connections setting.
- Have you lost the Debug window, e.g. you minimised it and can’t find it again? Press cmd-5 or hover over the square in the far bottom-left of the screen.
- Struggling to find the Path mappings dialog? Go to Preferences > Languages & Frameworks > PHP > Servers
- Common mapping errors: Typically failing to map the document root (e.g. say in WordPress, you’ve mapped wp-admin and nothing else.)
Skipping the Incoming Connection dialog
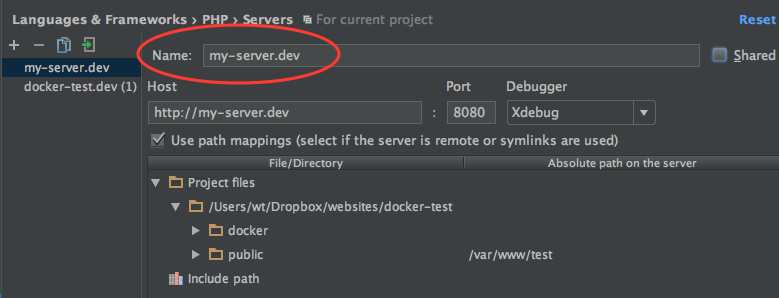
Note: you might want to set the PHP_IDE_CONFIG environment variable on your server. This tells PhpStorm which path mapping configuration it should use so it doesn’t prompt you. It needs to be written like this:
serverName=my-server.dev
where my-server.dev must match the name configured in Languages & Frameworks > PHP > Servers – as shown below:
PhpStorm’s Debug diagnostic tool
Go to: Run > Web Server Debug Validation (instructions here)
PhpStorm, Xdebug, Docker & Mac
Your Docker containers will have an IP address beginning 172.xxx.xxx.xxx (each container gets it’s own – check what it is) You might assume that’d be enough to avoid conflicts with your real IP address or 127.0.0.1 when specifying xdebug.remote_host.
Note: on macOS, you need to create a symlink to your IP otherwise PhpStorm won’t be able to hear Xdebug.
- Create the alias:
sudo ifconfig lo0 alias 10.254.254.254
- Put this new address (10.254.254.254) in:
– your /etc/hosts file (an entry for your project’s hostname)
– xdebug.remote_host (whether that’s in php.ini or an environment variable in docker-composer.yml)
– PhpStorm in Preferences > Languages & Frameworks > PHP > Debug > DBGp Proxy > host
Restart everything and things should start working.
Related info: